How Are In-App Advertising Rates Calculated?
How do mobile ad networks and exchanges determine in-app advertising rates? The answer isn’t always clear cut.
In-app ad rates can vary depending on a variety of factors including ad types, where the ad is run, what ad revenue-sharing agreements are in place, who is supposed to see the ad, whether the goals are of the ad campaign is to generate revenue or just increase brand recall, etc.
To help you make sense of all this, here is our guide to better understanding in-app ad rates.
Understanding Different Pricing Models in Mobile App Advertising
Brands and their advertising partners have a few different pricing models to choose from within the realm of in-app advertising. Let’s break down the most common ones out there today.
- CPM, which stands for Cost Per Mille, is one of the original and still most common way of paying for mobile ads. Essentially, this denotes the cost for 1,000 impressions of a particular ad. This is the basic way for paying for reach and initial awareness, in part because it’s easy to understand and works with just about any ad format imaginable. For instance, most Facebook ads - including mobile video ads - are paid for through CPM pricing. Curious why Mille is used here? It’s the Latin word for Thousand.
- In a cost per click (CPC) campaign, an advertiser only pays each time an ad creative is clicked on. The idea here is that the brand is only paying when someone actively interacted with the ad by clicking on it. This is how the ads that appear on search engine results pages, alongside ads in retargeting campaigns, are paid for typically.
- CPA often stands for cost per action or cost per acquisition. This takes CPC one step further; not only does someone need to click on an ad, but they also need to take a designated action, like filling out a form or downloading an app, before an advertiser is charged. This pricing model is typically used by advertisers and marketers with ad campaign goals further down the proverbial funnel. Similarly, some campaigns - particularly for companies with an app-centric business model - work on a CPI (cost per install) basis.
There’s also a nebulous fourth category: CPX. This essentially stands for cost per anything, or cost per X goal/metric. While CPM, CPC and CPA are by far the most commonly used pricing models, there are other emerging options that don’t fall neatly into either of the three aforementioned categories.
How Ad Formats Impact Ad Costs
In the world of mobile app advertising, not all ad formats are the same. The size and complexity of the ad format will impact how much an advertiser should expect to pay for the opportunity to run its creatives.
For example, consider the difference between banner ads and video ads. Formats that are more simplistic in nature, like many banner ads and display ads, are both easy to create and to insert into just about any app.
But, they’re also less eye-catching and thus easier to ignore. The average click-through rate of all banner ads is around 0.06 percent, but even that might be too high since around three in five banner ad clicks are thought to be accidental. That’s likely why, according to 2018 numbers cited by Business of Apps, the average CPM for all banner ads within mobile advertising environments is just $1.
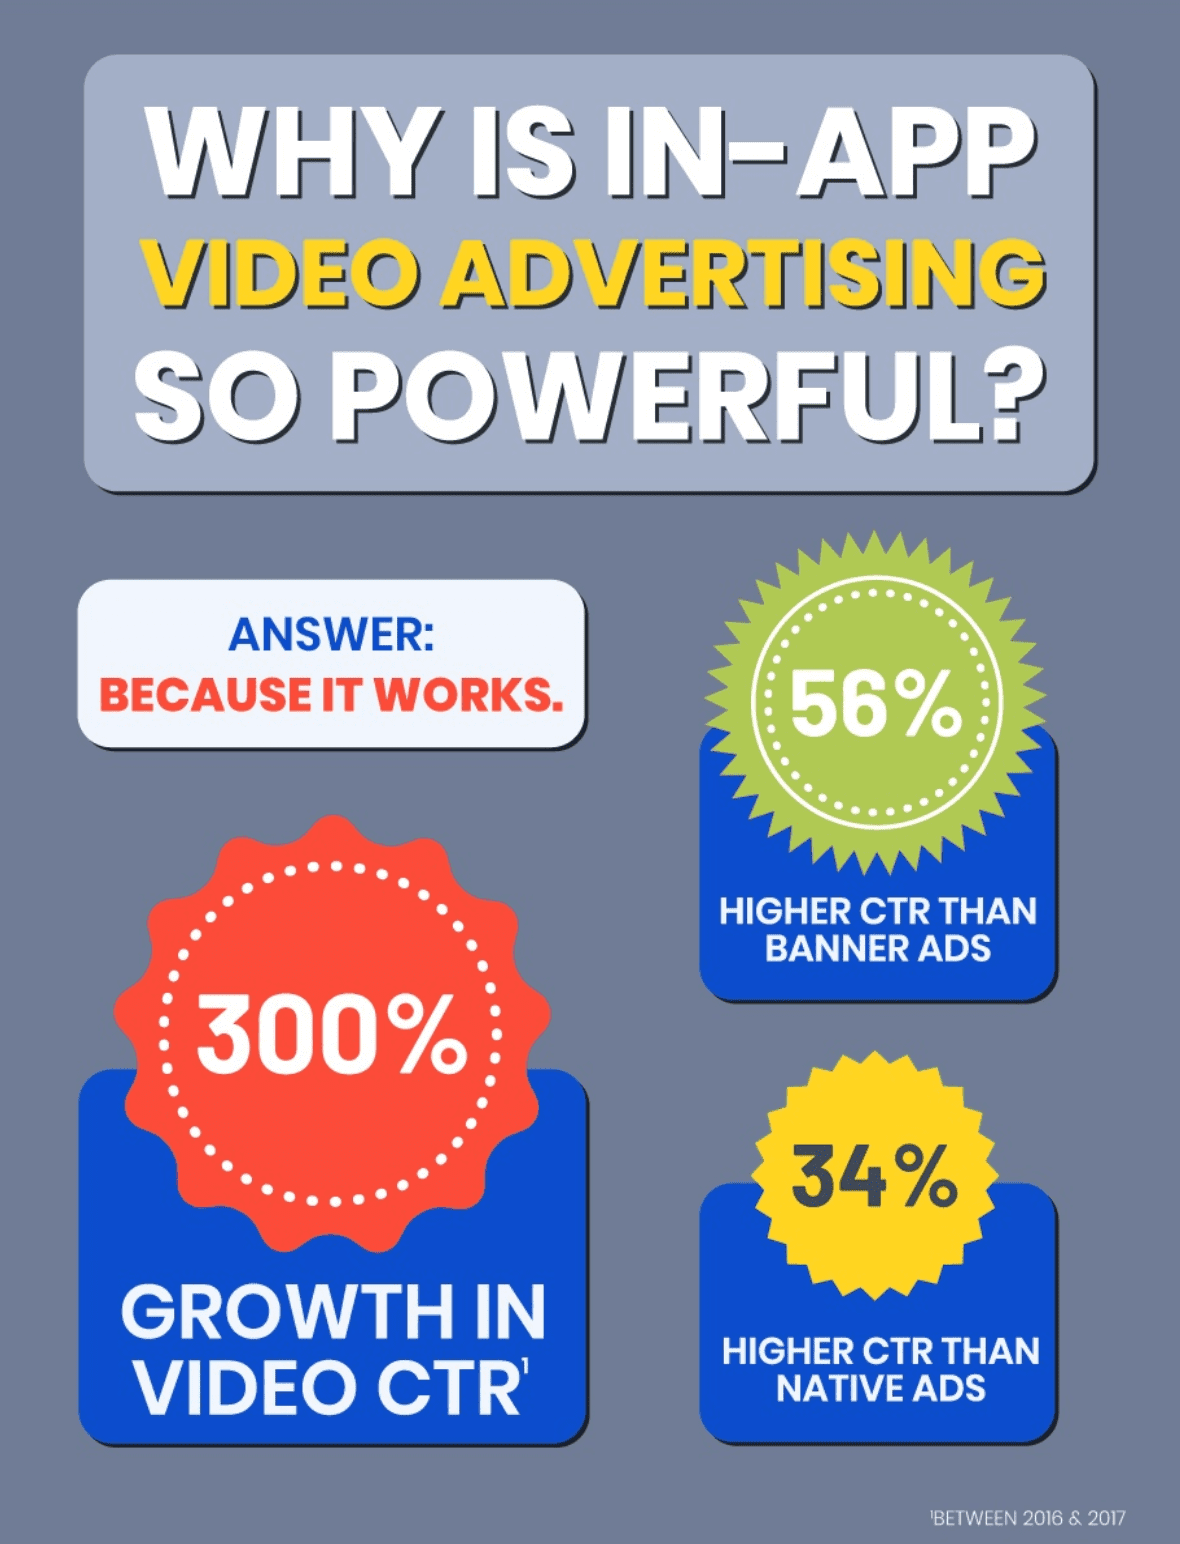
Contrast banner ads with video ads. While in-app video ads can take a wide variety of formats, including fullscreen video ads and videos with interactive end cards, all permutations of mobile video advertising share the same core characteristics: they’re memorable, engaging, eye-catching and highly effective. As a result, the average CPM for mobile video ads is 300 percent greater than the average CPM of a banner ad.
Impact of Target Audiences and Types of App Users on Rates for In-App Ads
But, in-app advertising rates are about much more than just formats. Other factors can also have an outsized influence on how much advertisers can/should pay.
- Operating System: In today’s mobile ecosystem, advertisers today really have two main mobile operating systems to think about, iOS and Android. Apple devices like the iPhone and the iPad use the iOS operating system while Samsung, the world’s largest manufacturer of smartphones, and many others use Android. Historically, iOS users were richer than Android users, making them a more lucrative target audience for advertisers. Brands can expect to pay 30 percent more to reach iOS users over Android typically, but specific prices vary by mobile ad network and exchange; on one major platform, advertisers paid 500 percent more to run ads to iOS users versus Android users, Business of Apps reported.
- Device Type: Brands may be willing to pay more (or less) to reach the users the specific types of devices. For starters, advertisers may prioritize smartphones over tablets, and be willing to pay extra to ensure their ads don’t appear in tablet environments. And even more specifically, brands will sometimes pay different advertising rates depending on the specific smartphone make and model someone is using. Some companies may find it tempting to run ads just for people using brand new mobile devices, as they be more willing to download new apps for it; alternatively, Samsung has previously had campaigns that targeted people using older devices so help compel them to upgrade.
- Geography: Where someone is located can impact how much an advertiser may be willing to pay to reach them. Country, region, city and neighborhood can all impact advertising rates. For example, some brands may see people in wealthy zip codes to be more valuable. And, according to statistics cited by Business of Apps, the average CPC for a mobile ad in Sweden is $0.51, while it’s significantly lower in Bulgaria at $0.03 per click. All of this is accomplished with non-personally identifiable location data too.
- Physical Location: On a more granular level, where someone is physically located at the moment when an ad is served can impact how much a brand might want to pay to ensure their ads reach them. For example, it’s easy to see a situation in which a sports apparel manufacturer might be okay spending more to run ads to people located within a stadium on game day. Similarly, brands that target business travelers might be willing to spend pay more than normal to ensure their ads show up when people are inside airports during the work week. Again, this is accomplished with non-personally identifiable location data.
- Time of Day: People are more likely to take certain actions off apps during particular times of the day, and so brands may be willing to alter their preferred payment rates accordingly. For instance, people are more likely to buy something online at 8pm than they are at, say, 6am. So, some advertisers may want to spend more to ensure their e-commerce ads appear during or right before peak shopping hours.
- Time of Year: Some times of the year are more competitive than other times, which can affect in-app advertising rates. The holiday shopping season in November and December is a prime example of this in action. According to the statistics cited by Business of Apps, between April 2015 and June 2016, average CPC for ad campaigns aiming to drive app installs peaked at around $0.45 per click in the final quarter of 2015 on one platform; in comparison, the lowest CPC was $0.27 per click in the second quarter of 2016.
Average CPM Rates in 2018
In addition to all of the average in-app ad rates previously discussed, here are more average CPMs to know, courtesy of Business of Apps.
- The average CPM across all Android devices is $2, and it’s $5 for all iOS hardware.
- The average CPM for a mobile interstitial ad in 2018 was $3.50.
- The average CPM for a native ad on mobile in 2018 was $10, making it one of the most expensive ad formats available.
- In 2016, the average CPC worldwide was $0.27.
How Will Mobile Advertisers Pay for In-App Ad Campaigns in 2019?
What in-app ad rates will brands pay throughout 2019? Only time will tell. But, one thing for certain is that advertisers and their partners will be savvier about how they track and measure their mobile app ad campaigns. As mobile devices and apps increase in popularity, brands and agencies will pay closer attention to not only how they’re paying for mobile ads but also how those ads are performing from a holistic and business lens.
Interesting in learning more about mobile in-app advertising? Be sure to check out these blog posts for more insights, knowledge and know-how.
LEARN MORE